Topics on this page
Customize the dashboard
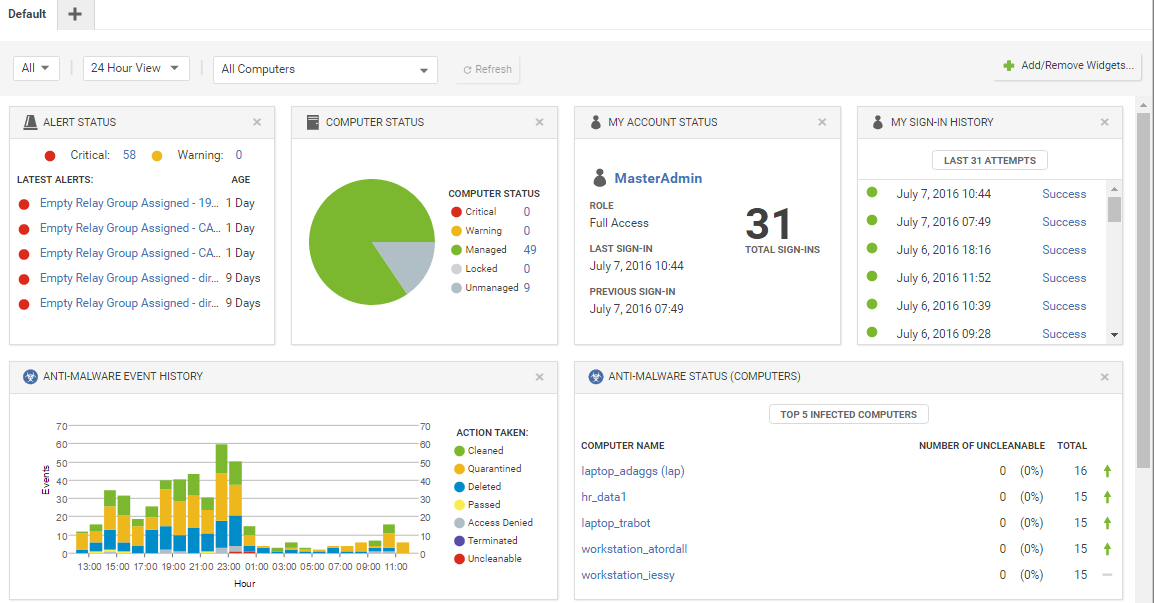
The dashboard is the first page that appears after you log in to the Workload Security console.
You can customize the contents and layout of their dashboard. Workload Security automatically saves your settings and remembers your dashboard the next time you log in. You can also configure the data's time period, and which computer's or computer group's data is displayed.
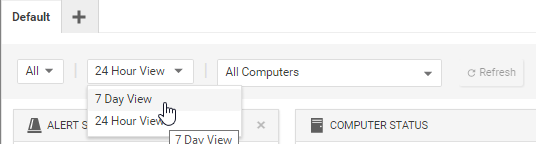
Date and time range
The dashboard can display data from either the last 24 hours or the last seven days.
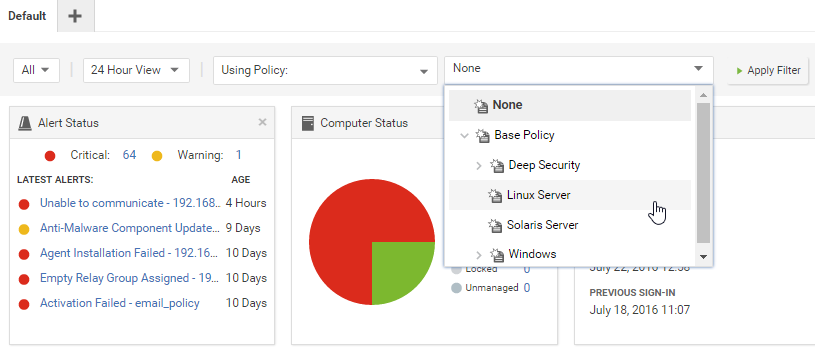
Computers and computer groups
Use the Computer menu to filter the displayed data to display only data from specific computers. For example, only those using the Linux Server security policy:
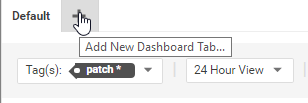
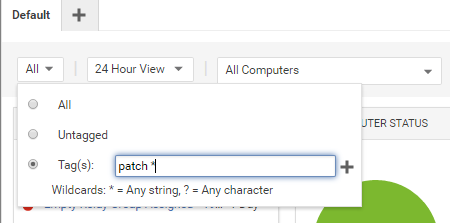
Filter by tags
In Workload Security, a Tag is a unit of meta-data that you can apply to an Event in order to create an additional attribute for the Event that is not originally contained within the Event itself. Tags can be used to filter Events in order to simplify the task of Event monitoring and management. A typical use of tagging is to distinguish between Events that require action and those that have been investigated and found to be benign.
The data displayed in the Dashboard can be filtered by tags:
For more information, see Apply tags to identify and group events.
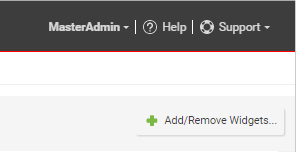
Select dashboard widgets
Click Add/Remove Widgets to display the widget selection window and choose which widgets to display.
If widgets take up extra space on the dashboard (more than 1x1), their dimensions are listed next to their names.
The following widgets are available:
Monitoring
- Activity Overview: Overview of activity, including the number of protected hours and size of database.
- Alert History [2x1]: Displays recent alert history, including the severity of alerts.
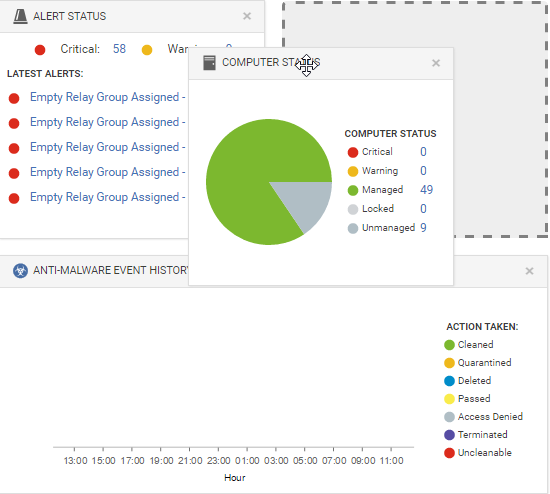
- Alert Status: Summary of alerts, including their age and severity.
- Computer Status: Summary of computers, including whether they are managed or unmanaged, and if there are any warnings or critical alerts.
- License Information: Displays license information, including the number of protected computers.
- Security Update Status: Displays the update status of computers, including the number of computers that are up-to-date, out-of-date, and unknown.
System
- My Sign-in History: Displays the last 50 sign-in attempts and whether or not they were successful.
- My User Summary [2x1]: Displays a summary of the user, including name, role, and sign-in information.
- Software Updates: Displays out-of-date computers.
- System Event History [2x1]: Displays recent system event history, including the number of events that are categorized as info, warning, or error.
Ransomware
- Ransomware Event History [3x1]: Displays recent ransomware event history, including the event type.
- Ransomware Status: Displays the status of ransomware, including the number of ransomware events that occurred in the last 24 hours, the last 7 days, or the last 13 weeks.
Anti-Malware
- Anti-Malware Event History [2x1]: Displays recent Anti-Malware event history, including the action taken for the events.
- Anti-Malware Protection Status: Displays a summary of Anti-Malware Protection status on computers, including whether they are protected, unprotected, or not capable of being protected.
- Anti-Malware Status (Computers) [2x1]: Displays the top five infected computers, including the amount of uncleanable files and the total number of files affected.
- Anti-Malware Status (Malware) [2x1]: Displays the top five detected malware, including their name, amount of uncleanable files, and number of times it was triggered.
- Malware scan Status [2x1]: Displays the top five appliances with incomplete scheduled malware scans.
Web Reputation
- Web Reputation Computer Activity: Displays the top five computers with Web Reputation events, including the number of events.
- Web Reputation Event History [2x1]: Displays recent Web Reputation event history, including the events severity.
- Web Reputation URL Activity: Displays the top five URLs that triggered Web Reputation events, including the number of times they were accessed.
Firewall
- Firewall Activity (Detected): Displays the top five reasons packets were detected, including the number of times.
- Firewall Activity (Prevented): Displays the top five reasons packets were prevented, including the number of times.
- Firewall Computer Activity (Detected): Displays the top five computers that generated detected Firewall events and the number of times they occurred.
- Firewall Computer Activity (Prevented): Displays the top five computers that generated prevented Firewall events and the number of times they occurred.
- Firewall Event History [2x1]: Displays recent Firewall event history, including if the events were detected or prevented.
- Firewall IP Activity (Detected): Displays the top five source IPs that generated detected Firewall events and the number of times they occurred.
- Firewall IP Activity (Prevented): Displays the top five source IPs that generated prevented Firewall events and the number of times they occurred.
- Firewall Port Activity (Detected): Displays the top five destination ports for detected Firewall events and the number of times they occurred.
- Firewall Port Activity (Prevented): Displays the top five computers that generated prevented Firewall events and the number of times they occurred.
- Reconnaissance Scan Activity: Displays the top five detected reconnaissance scans, including the number of times they occurred.
- Reconnaissance Scan Computers: Displays the top five computers where reconnaissance scans occurred and the number of times they occurred.
- Reconnaissance Scan History [2x1]: Displays recent reconnaissance scan history, including the type of scan that occurred.
Intrusion Prevention
- Application Type Activity (Detected): Displays the top five detected application types, including the number of times they were triggered.
- Application Type Activity (Prevented): Displays the top five prevented application types, including the number of times they were triggered.
- Application Type Treemap (Detected) [2x2]: Displays a map of detected application types. Hover over the boxes to display the severity of the events, the number of times it was triggered, and the percentage for each severity level.
- Application Type Treemap (Prevented) [2x2]: Displays a map of prevented application types. Hover over the boxes to display the severity of the events, the number of times it was triggered, and the percentage for each severity level.
- IPS Activity (Detected): Displays the top five reasons Intrusion Prevention events were detected, including the number of times it was triggered.
- IPS Activity (Prevented): Displays the top five reasons Intrusion Prevention events were prevented, including the number of times it was triggered.
- IPS Computer Activity (Detected): Displays the top five computers with detected Intrusion Prevention events.
- IPS Computer Activity (Prevented): Displays the top five computers with prevented Intrusion Prevention events.
- IPS Event History [2x1]: Displays recent Intrusion Prevention event history, including if the events were detected or prevented.
- IPS IP Activity (Detected): Displays the top five source IPs that generated detected Intrusion Prevention events.
- IPS IP Activity (Prevented): Displays the top five source IPs that generated prevented Intrusion Prevention events.
- Latest IPS Activity (Detected): Displays the top five reasons Intrusion Prevention events were detected since the latest update.
- Latest IPS Activity (Prevented): Displays the top five reasons Intrusion Prevention events were prevented since the latest update.
Integrity Monitoring
- Integrity Monitoring Activity: Displays the top five reasons Integrity Monitoring events occurred, including the number of times. In this case, the reason refers to the rule that was triggered.
- Integrity Monitoring Computer Activity: Displays the top five computers where Integrity Monitoring events occurred, including the number of events.
- Integrity Monitoring Event History [2x1]: Displays recent Integrity Monitoring event history, including the severity of events.
- Integrity Monitoring Key Activity: Displays the top five keys for Integrity Monitoring events. The source of the key varies by Entity Set - for files and directories it's their path, whereas for ports it's their unique protocol, IP, port number, or tuple.
Log Inspection
- Log Inspection Activity: Displays the top five reasons Integrity Monitoring events occurred, including the number. In this case, the reason refers to the rule that was triggered.
- Log Inspection Computer Activity: Displays the top five computers where Log Inspection events occurred, including the number of events.
- Log Inspection Description Activity: Displays the top five descriptions for Log Inspection events, including the number of times they occurred. The description refers to the event that was triggered.
- Log Inspection Event History [2x1]: Displays recent Log Inspection event history, including the severity of events.
Application Control
- Application Control Maintenance Mode Status [2x1]: Displays the computers in maintenance mode, including their start and end time.
Change the layout
The selected widgets can be moved around the dashboard by dragging them by their title bar. Move the widget over an existing one and they will exchange places. The widget that is about to be displaced temporarily grays out.
Save and manage dashboard layouts
You can create multiple dashboard layouts and save them as separate tabs. Your Dashboard settings and layouts are not visible to other users after you sign out. To create a new Dashboard tab, click the plus symbol to the right of the last tab on the Dashboard: