Topics on this page
Compliance Evolution
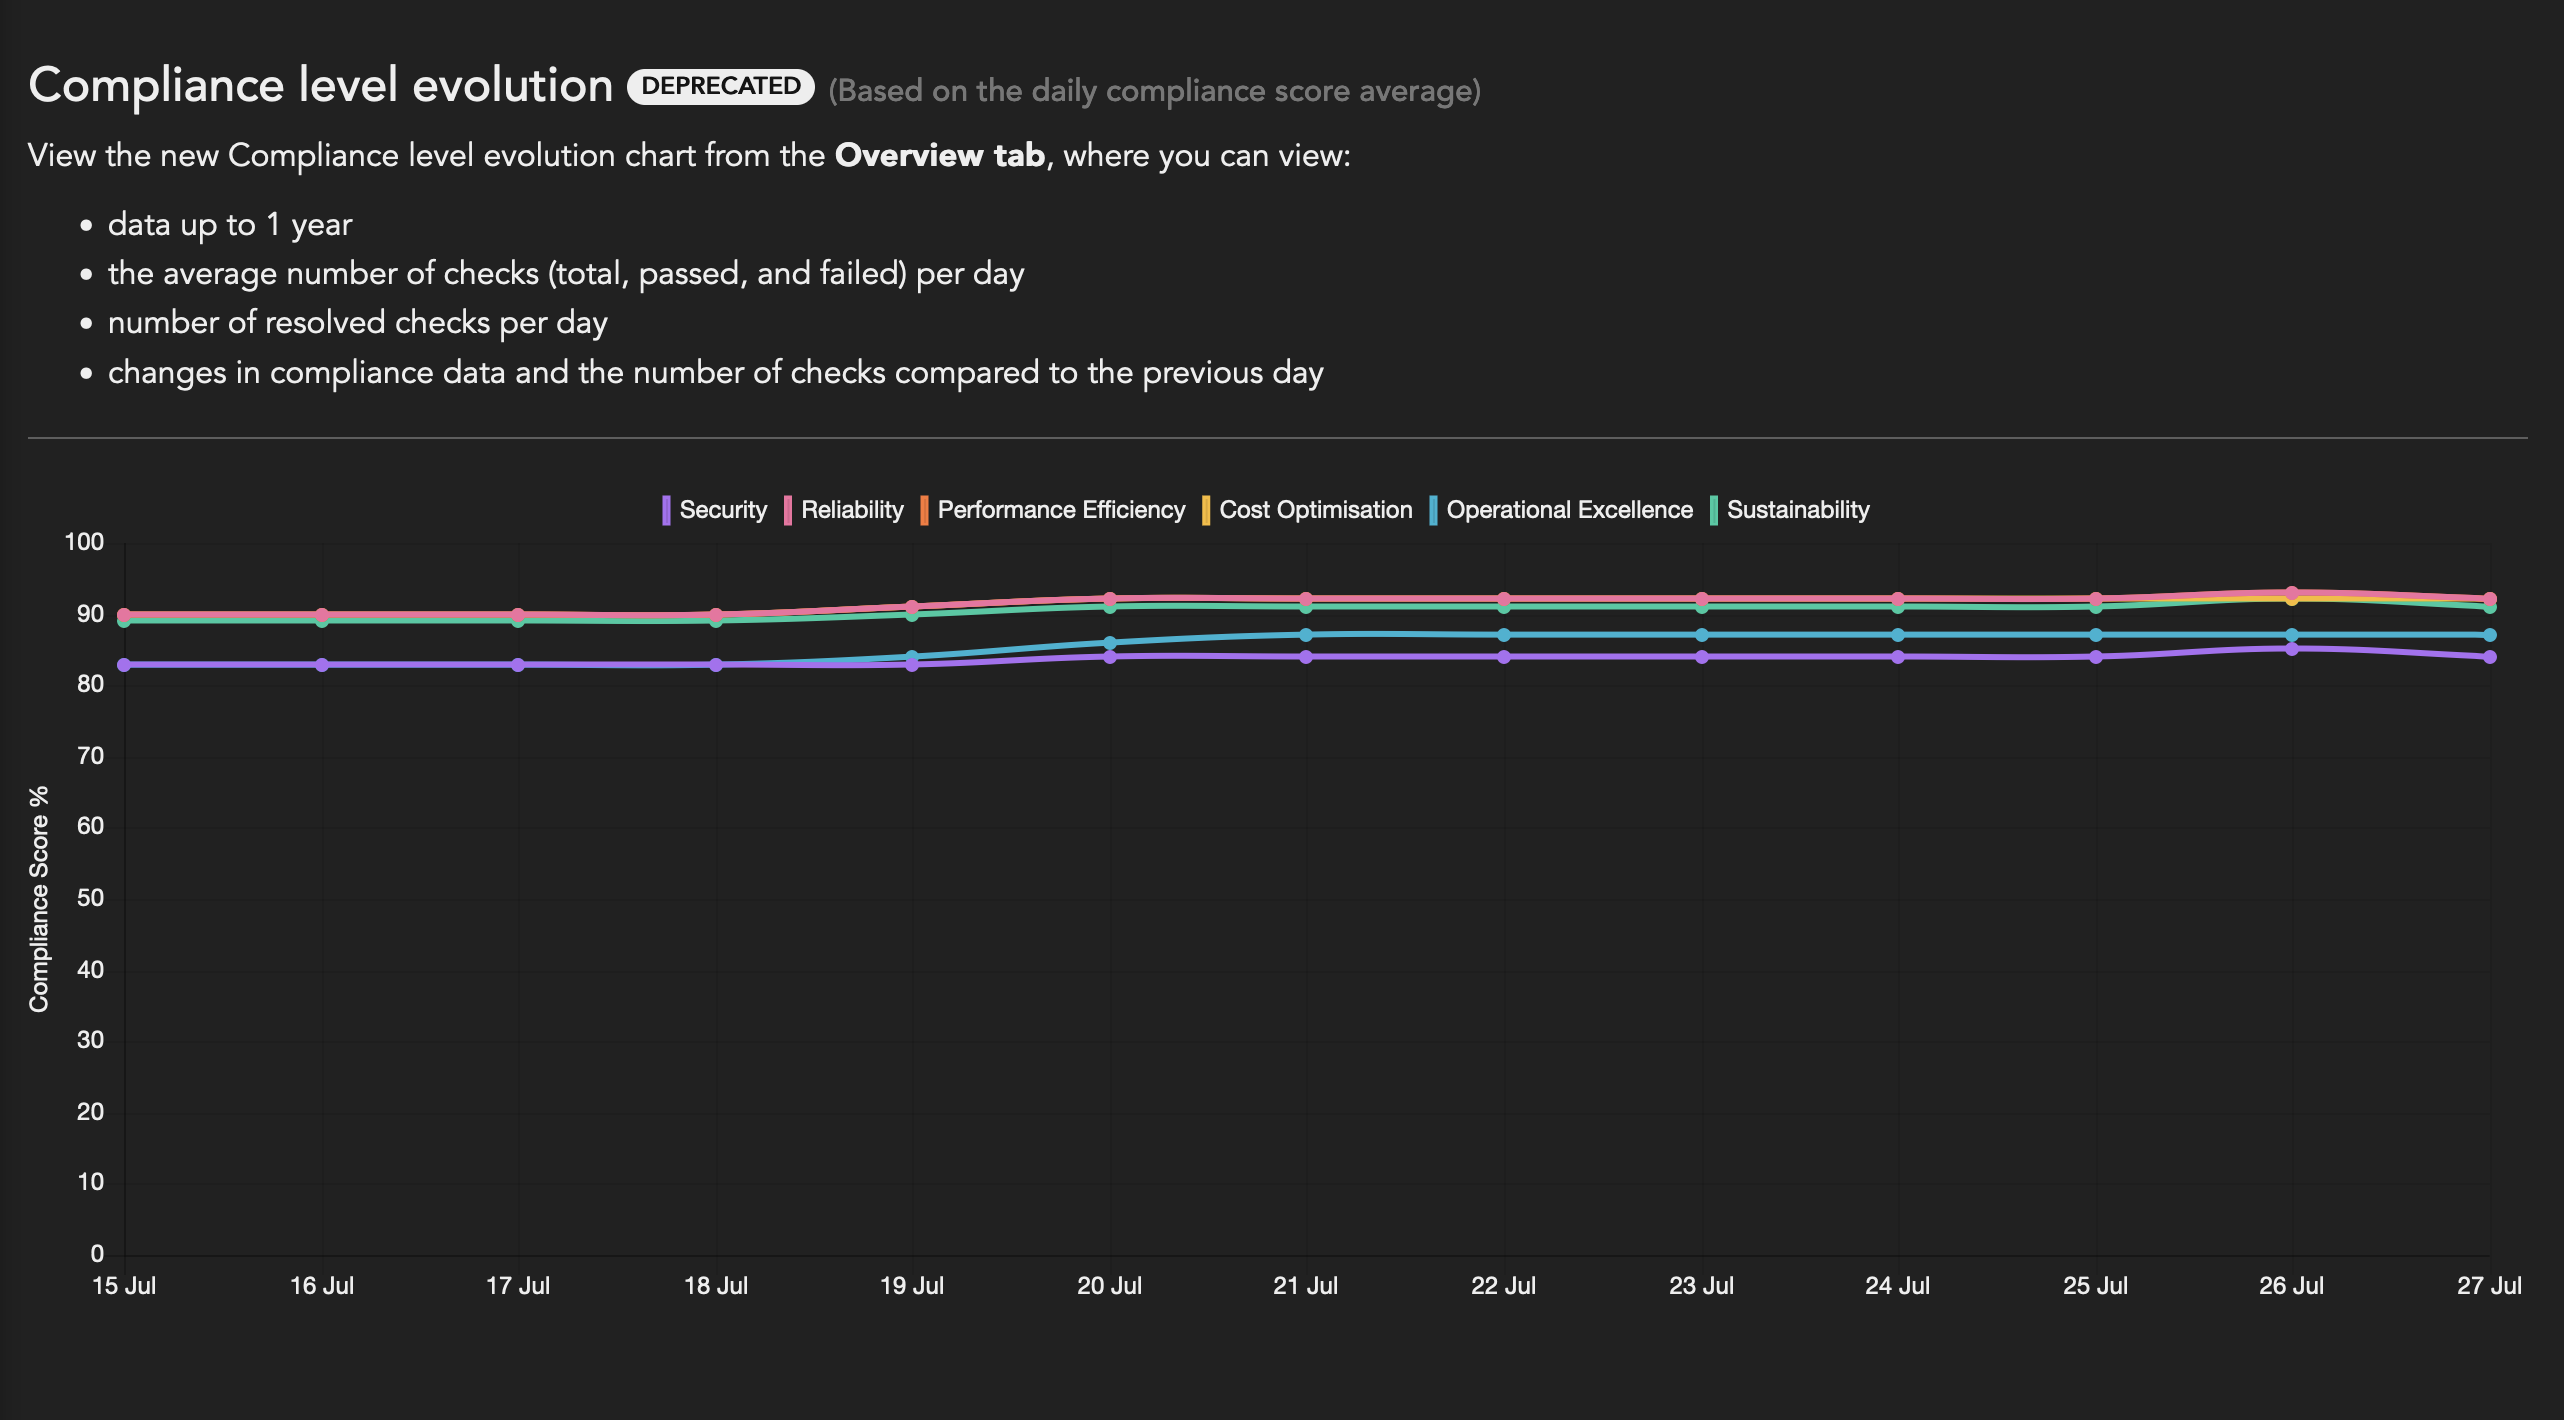
| Location | Main Dashboard > Select {Account(s)} > Compliance level evolution |
The Compliance evolution graph shows the change in compliance levels within All accounts, Individual accounts, or Groups over the last 30 days. The graph sets out the scores against the six pillars of the AWS Well-Architected Framework
- Security
- Cost Optimization
- Operational Excellence
- Reliability
- Performance Efficiency
- Sustainability
Calculation of Daily Compliance Evolution Score for all Categories
Individual Conformity Account Evolution Score
Conformity Bot can run multiple times per day, thus an average is calculated for all the Conformity Bot runs. For each account, the individual scores of each category is obtained by the following formula for every bot run.
(Total number of successful Checks for the category / Total number of Checks for the category) * 100 = category score
For example:
Account 1: had two bot runs for the day as below:
| Bot Run No. | Success Check count | Total check count |
|---|---|---|
| First Bot Run | 50 |
100 |
| Second Bot Run | 30 |
100 |
Average score for this category of Account 1 for a day = (50 + 30) / (100 + 100) = 40%
Group Accounts Evolution Score
For group accounts, the average score of each category is calculated by averaging all the category scores of all accounts for the day:
For Example:
Account 1: had two bot runs for the day as per the example above (50 + 30) / (100 + 100) = 40%
Account 2: had three bot runs for the day as below:
| Bot Run No. | Success Check count | Total check count |
|---|---|---|
| First Bot Run | 50 |
125 |
| Second Bot Run | 30 |
100 |
| Third Bot Run | 30 |
100 |
Average score for this category for Account 2 for a day = (50 + 30 + 20) / (125 + 100 + 75) = 33%
Group account evolution score (Comprising of Account 1 and Account 2) = (50 + 30 + 50 + 30 + 20) / (100 + 100 + 125 + 100 +75) = 36%