Topics on this page
Manage events
The Application Security agent inspects every request submitted to your application and executes the security checks as specified by your policy. An event is triggered when a security threat occurs and triggers a rule in your policy.
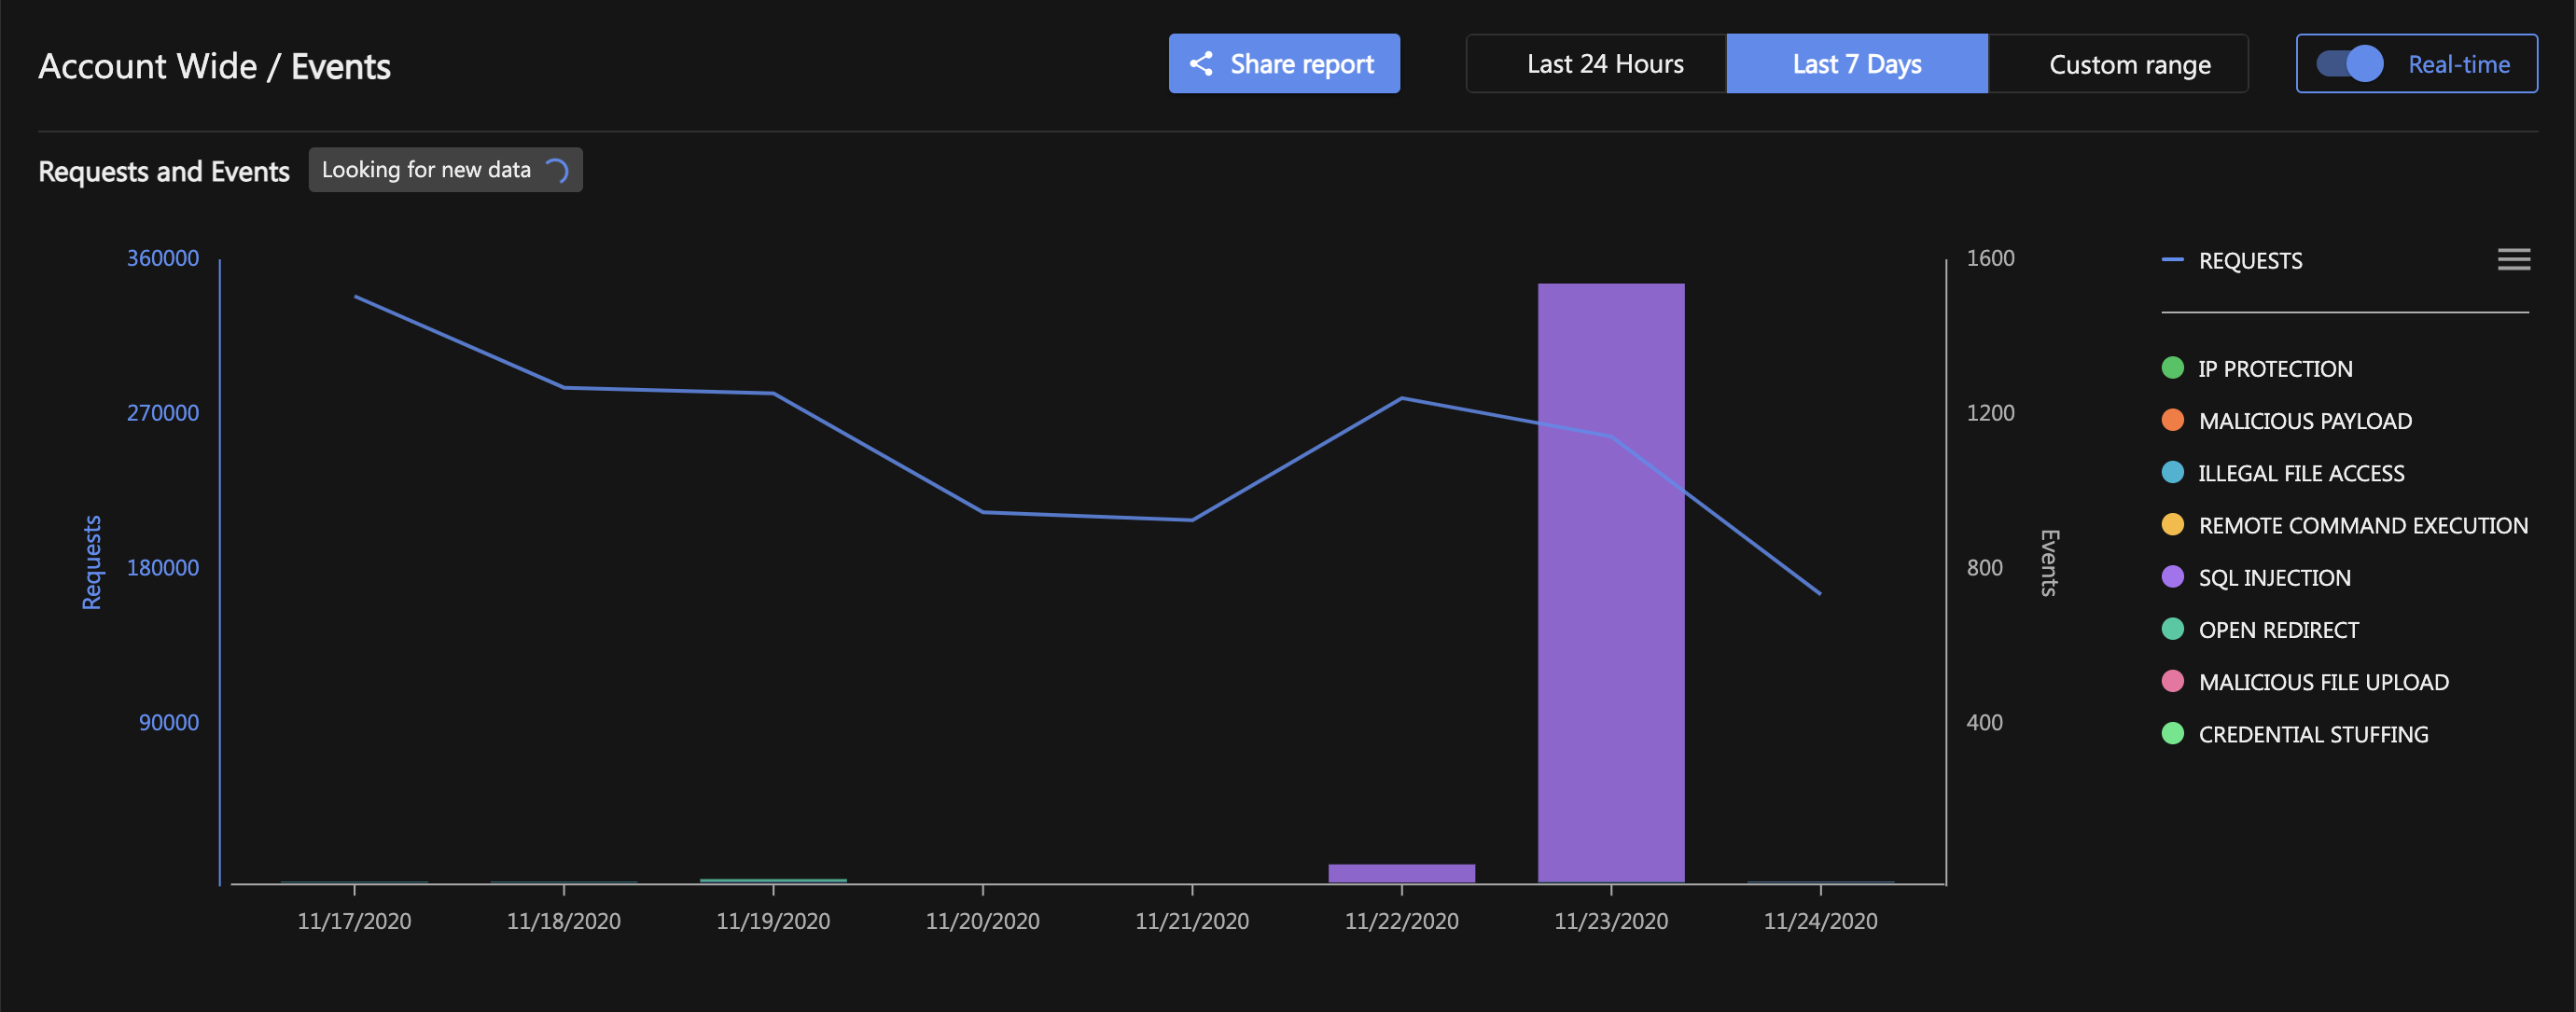
Events chart
The chart on the Events page shows:
- REQUESTS: The number of requests or invocations inspected and protected by the Application Security agent. The scale of the number of requests is shown on the left of the chart.
-
EVENTS: The collection of security events triggered by the Application Security agent, from all of your groups. The scale of the number of events is shown on the right of the chart.
On the left of the dashboard, select your group to see all of the events that are specific to your group. To view events for multiple groups, Shift-click to select and deselect individual groups. A lock icon will appear to the left of the group when it is included in the view of events.
Events can be displayed in real time, which is the default:

Or for a specific range of dates:

Events table
The events table is a scrollable table that lists the most recent events within the time frame specified above. (The number of recent events is, by default, 10, but can be changed in the page size drop-down list.)

Event details
The events details panel displays the details of all the triggered events.

The image above shows the multitude of information relating to every type of event including:
- Attack type
- Affected group
- Action taken on the event by the agent
- Event priority
- Attacker IP
- Time of event
- Request details
- MITRE attack information
The Request Details panel displays the following information:
- Transaction Type
- Invocation Type
- Scheme
- Server name
- Server port
- Path
- Source IP
- Host header
The MITRE Attack information panel displays MITRE attack identification numbers and links to the MITRE website. The attack ID number is related as closely as possible to the vulnerability that triggered the event.

Below the event's MITRE Attack Information panel is the Triggered Rule Details panel, which has specific details about the attack type, depending on the triggered event. For more information, see:
- Malicious Payload events
- SQL Injection events
- Illegal File Access events
- Remote Command Execution events
- Open Redirect events
- Malicious File Upload events
- IP Protection events
Event priority
Event priorities are an indication of the severity of an event and the action needed on said event. The priority of an event can be found in the events table or an events details panel.


Event priorities are divided into three categories:
- High: Take action, configuring policies is recommended
- Medium: Review event, action may be needed
- Low: Review recommended, however action probably not needed